Phoenix Urban Heat Island Project (2025)
Interactive data visualization | Windsurf, v0 (Vercel), Visual Studio Code, ChatGPT, Chart.js
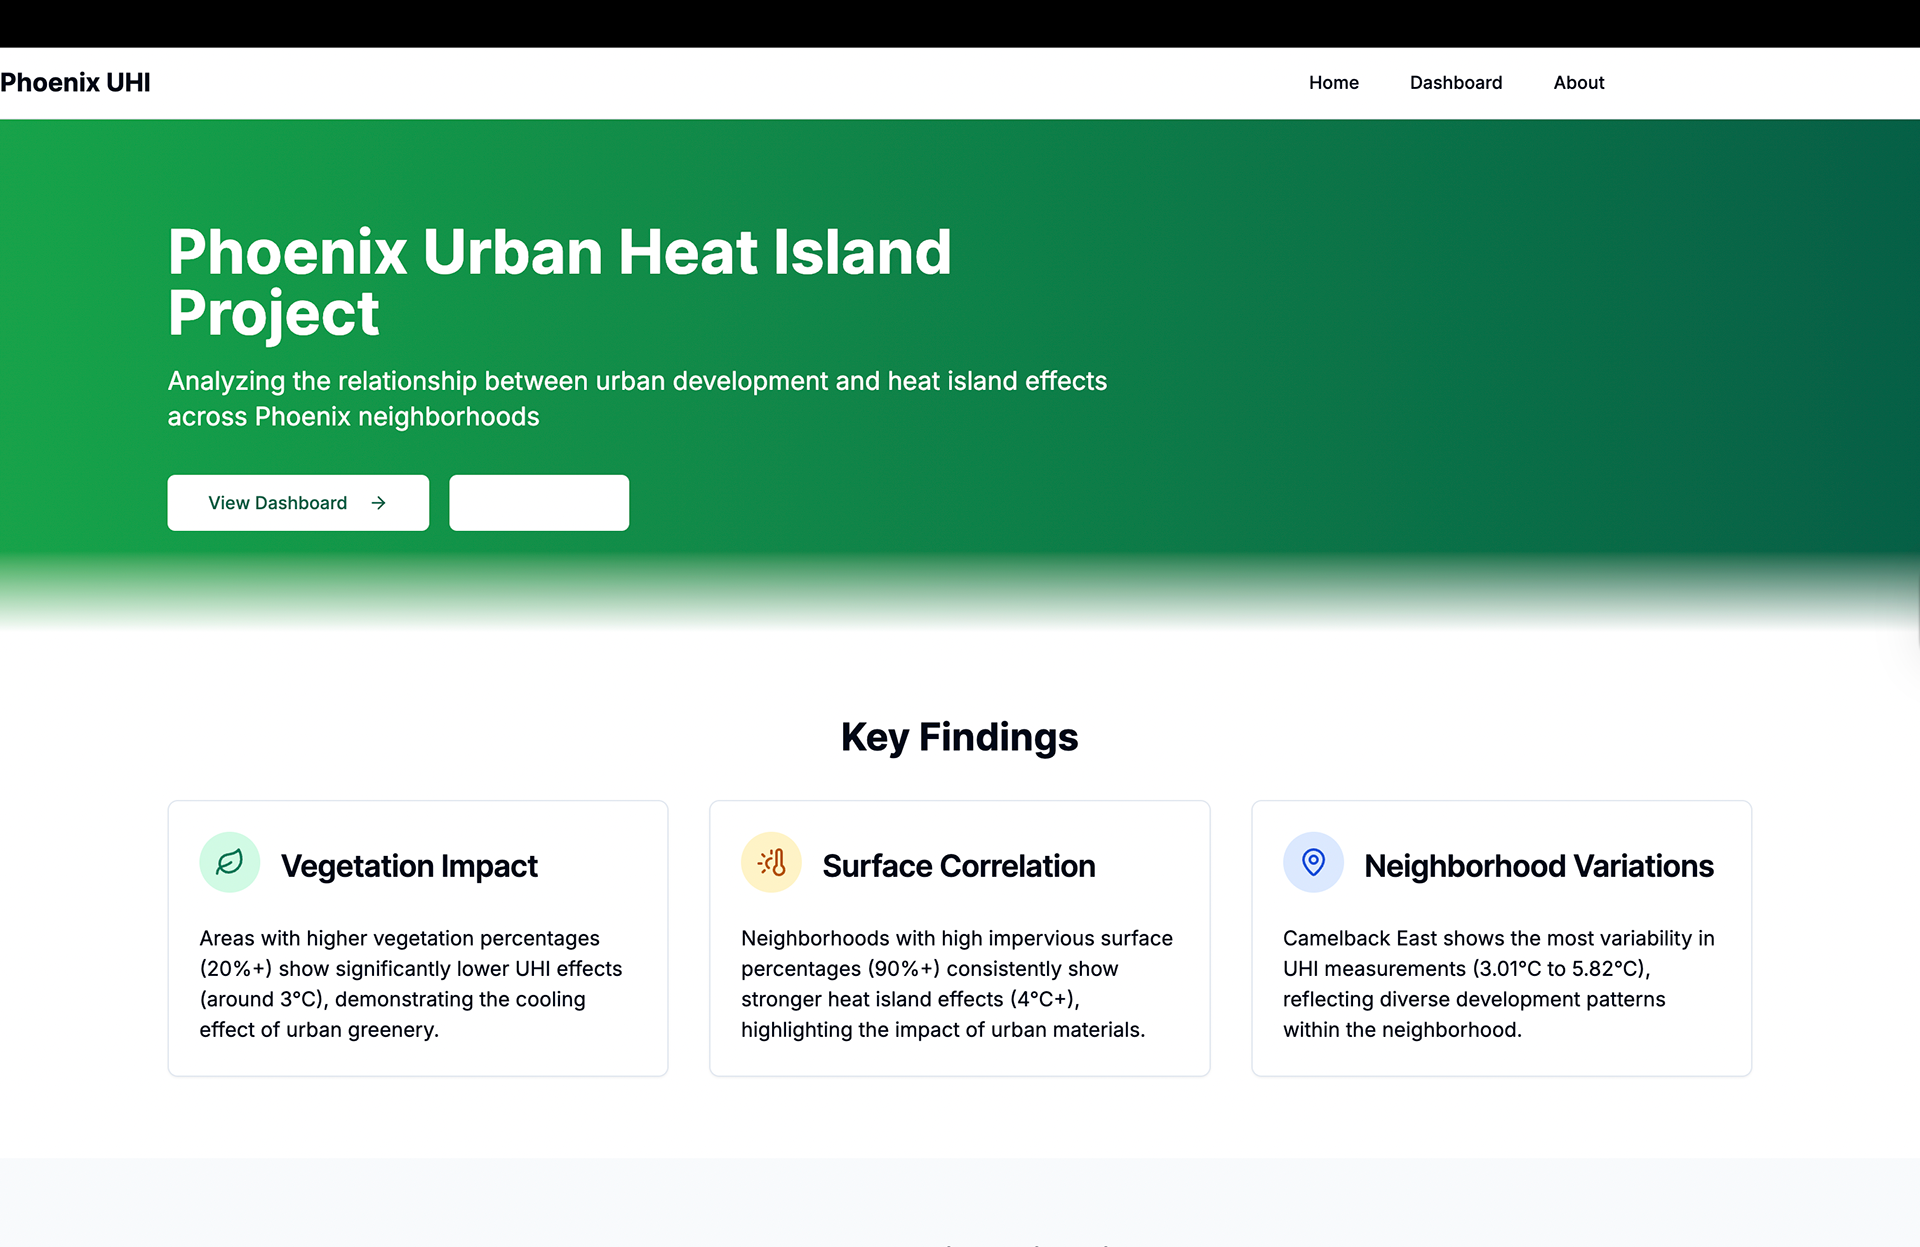
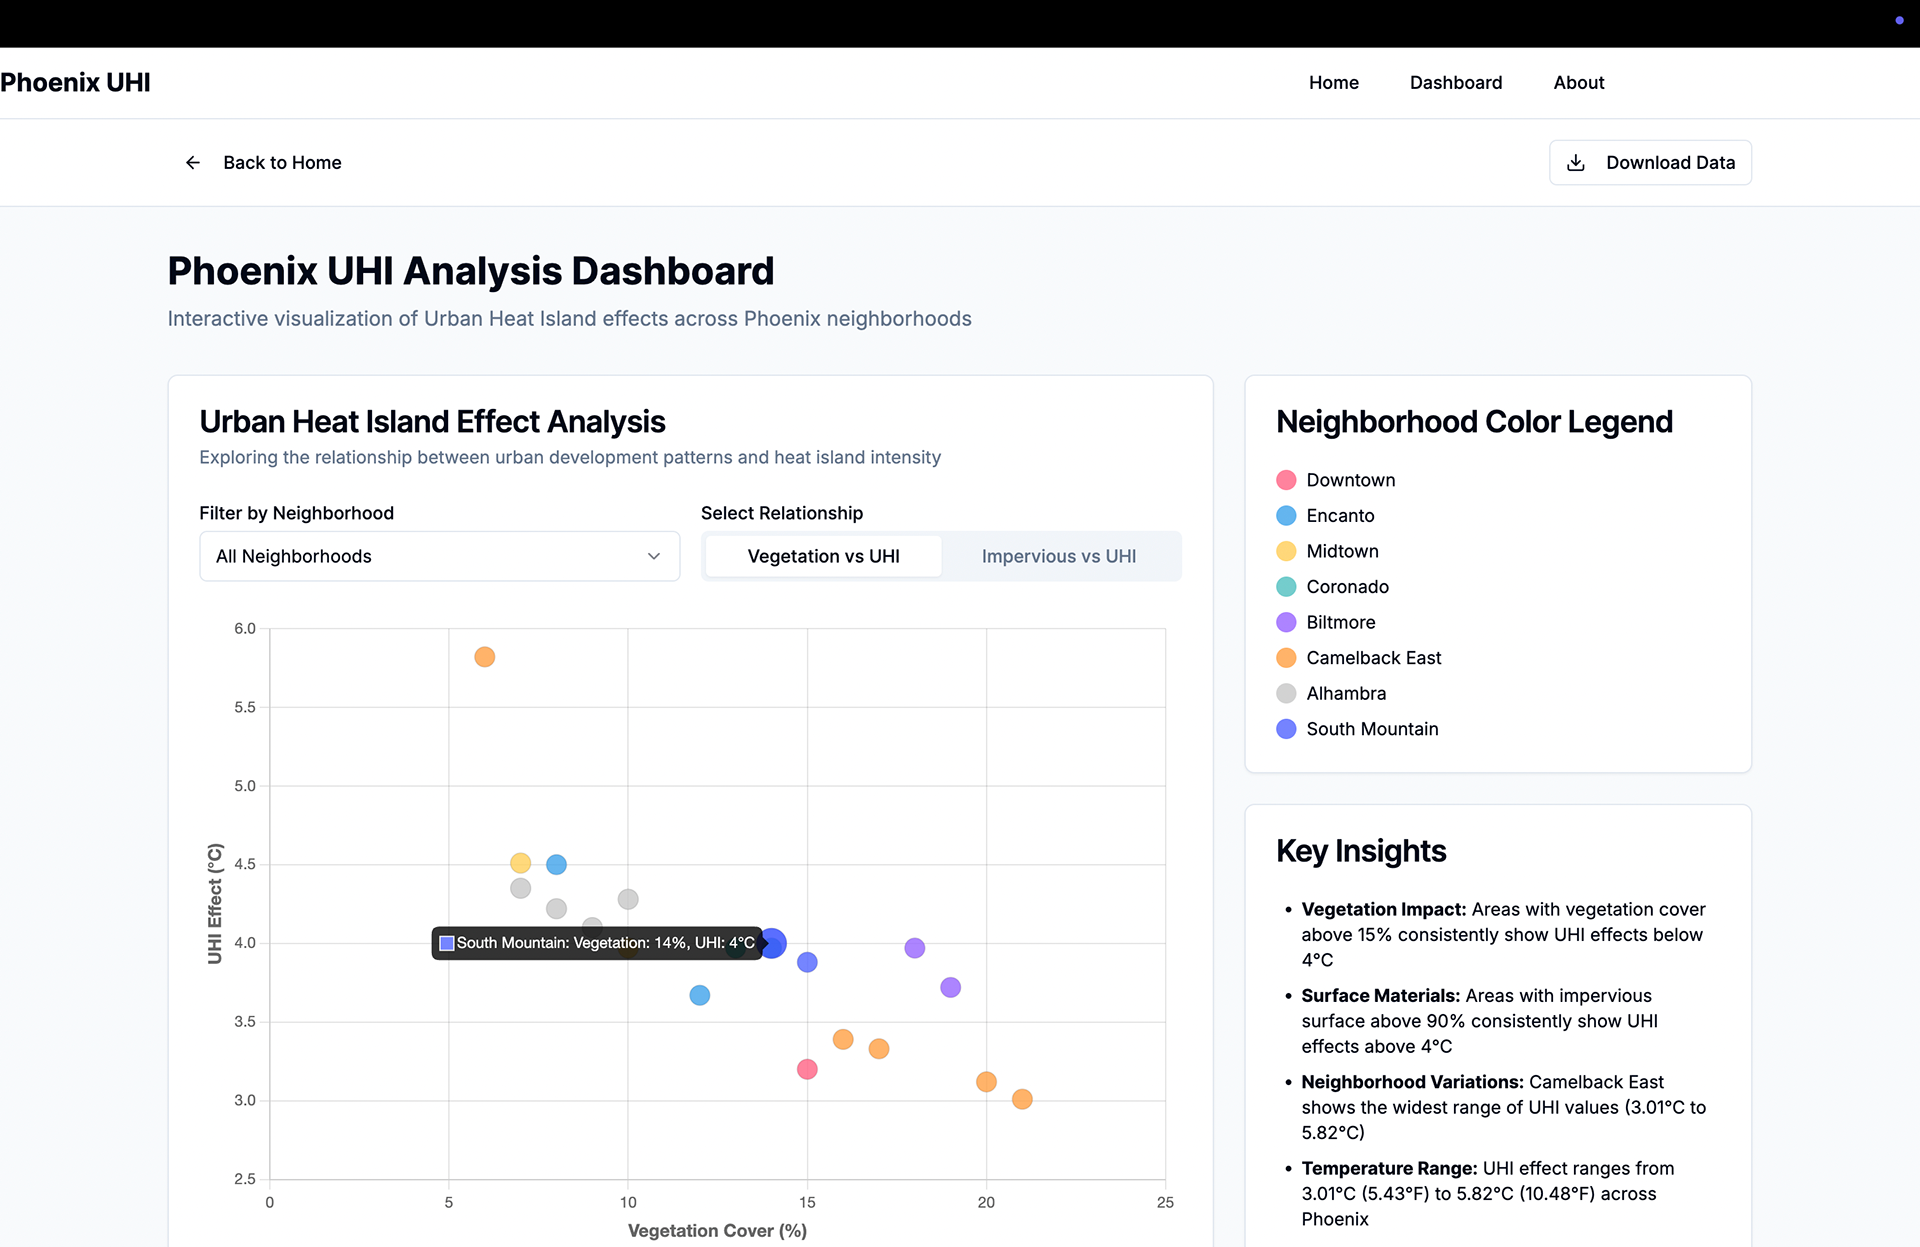
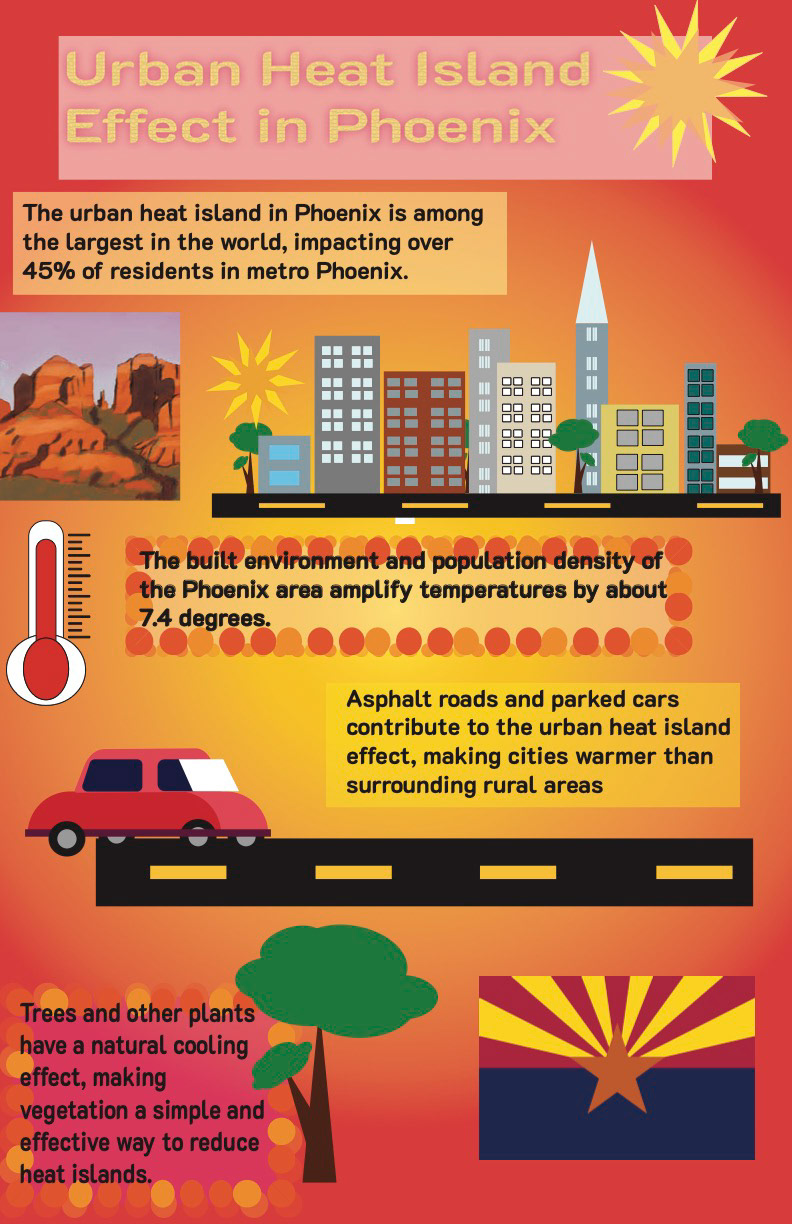
This data visualization project looks at how Phoenix’s urban areas shape neighborhood heat through an interactive dashboard. Users can switch between vegetation and impervious surface, or urban heat island, filter by neighborhood, and view live correlations. The data on this site showcases how vegetation cools neighborhoods, while impervious areas heat neighborhoods in places like Camelback East (3.01°C–5.82°C).
I built the site as a fast, simple web app for a project. I wanted it to focus on clarity and make climate data visual, easy to understand, and usable. My process combined Windsurf, Vercel, and VS Code with rapid prototyping through ChatGPT. The final interface includes interactive scatterplots, two other resources, key insights, and color legends!
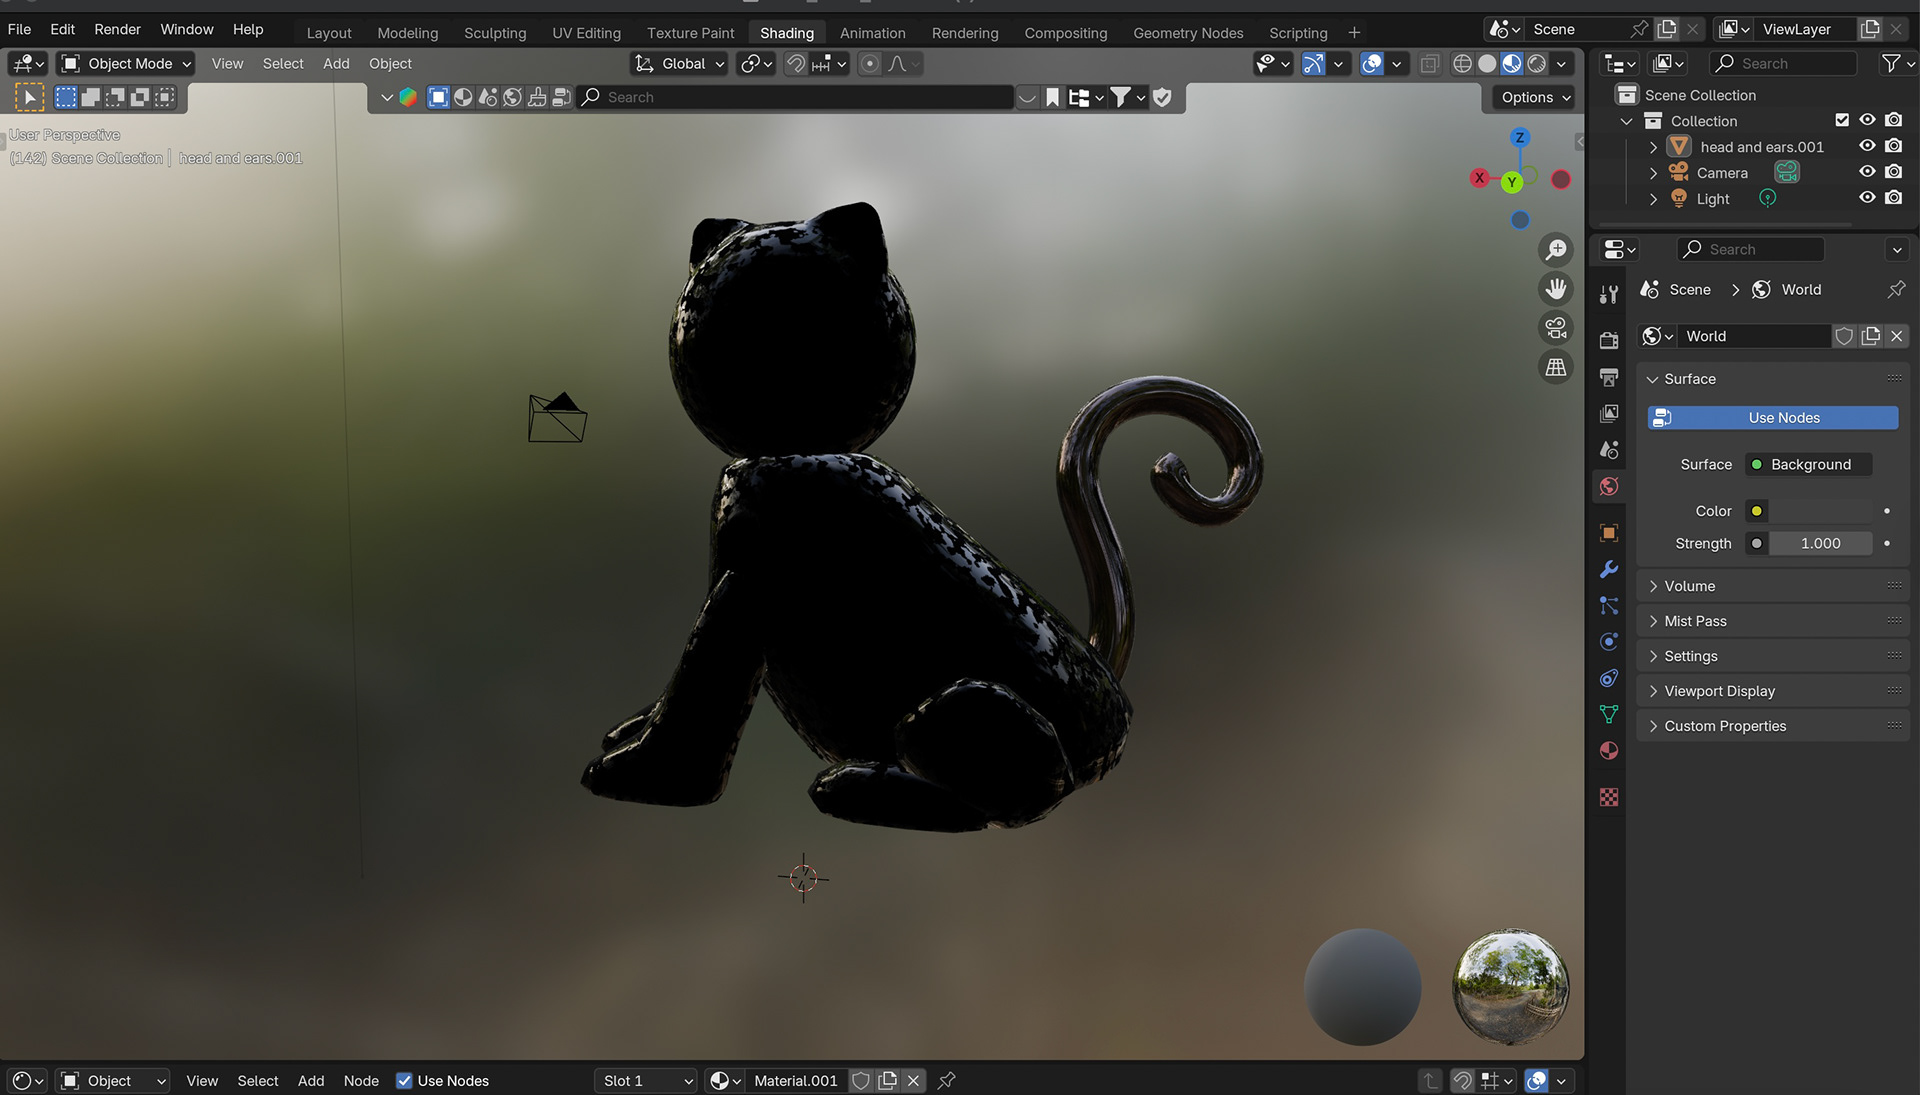
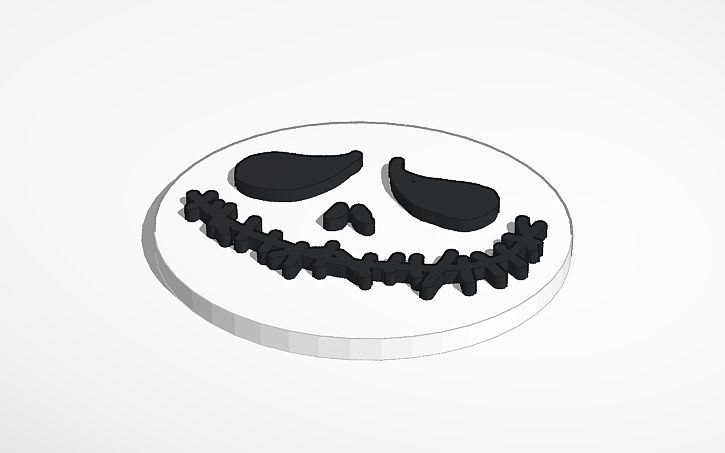
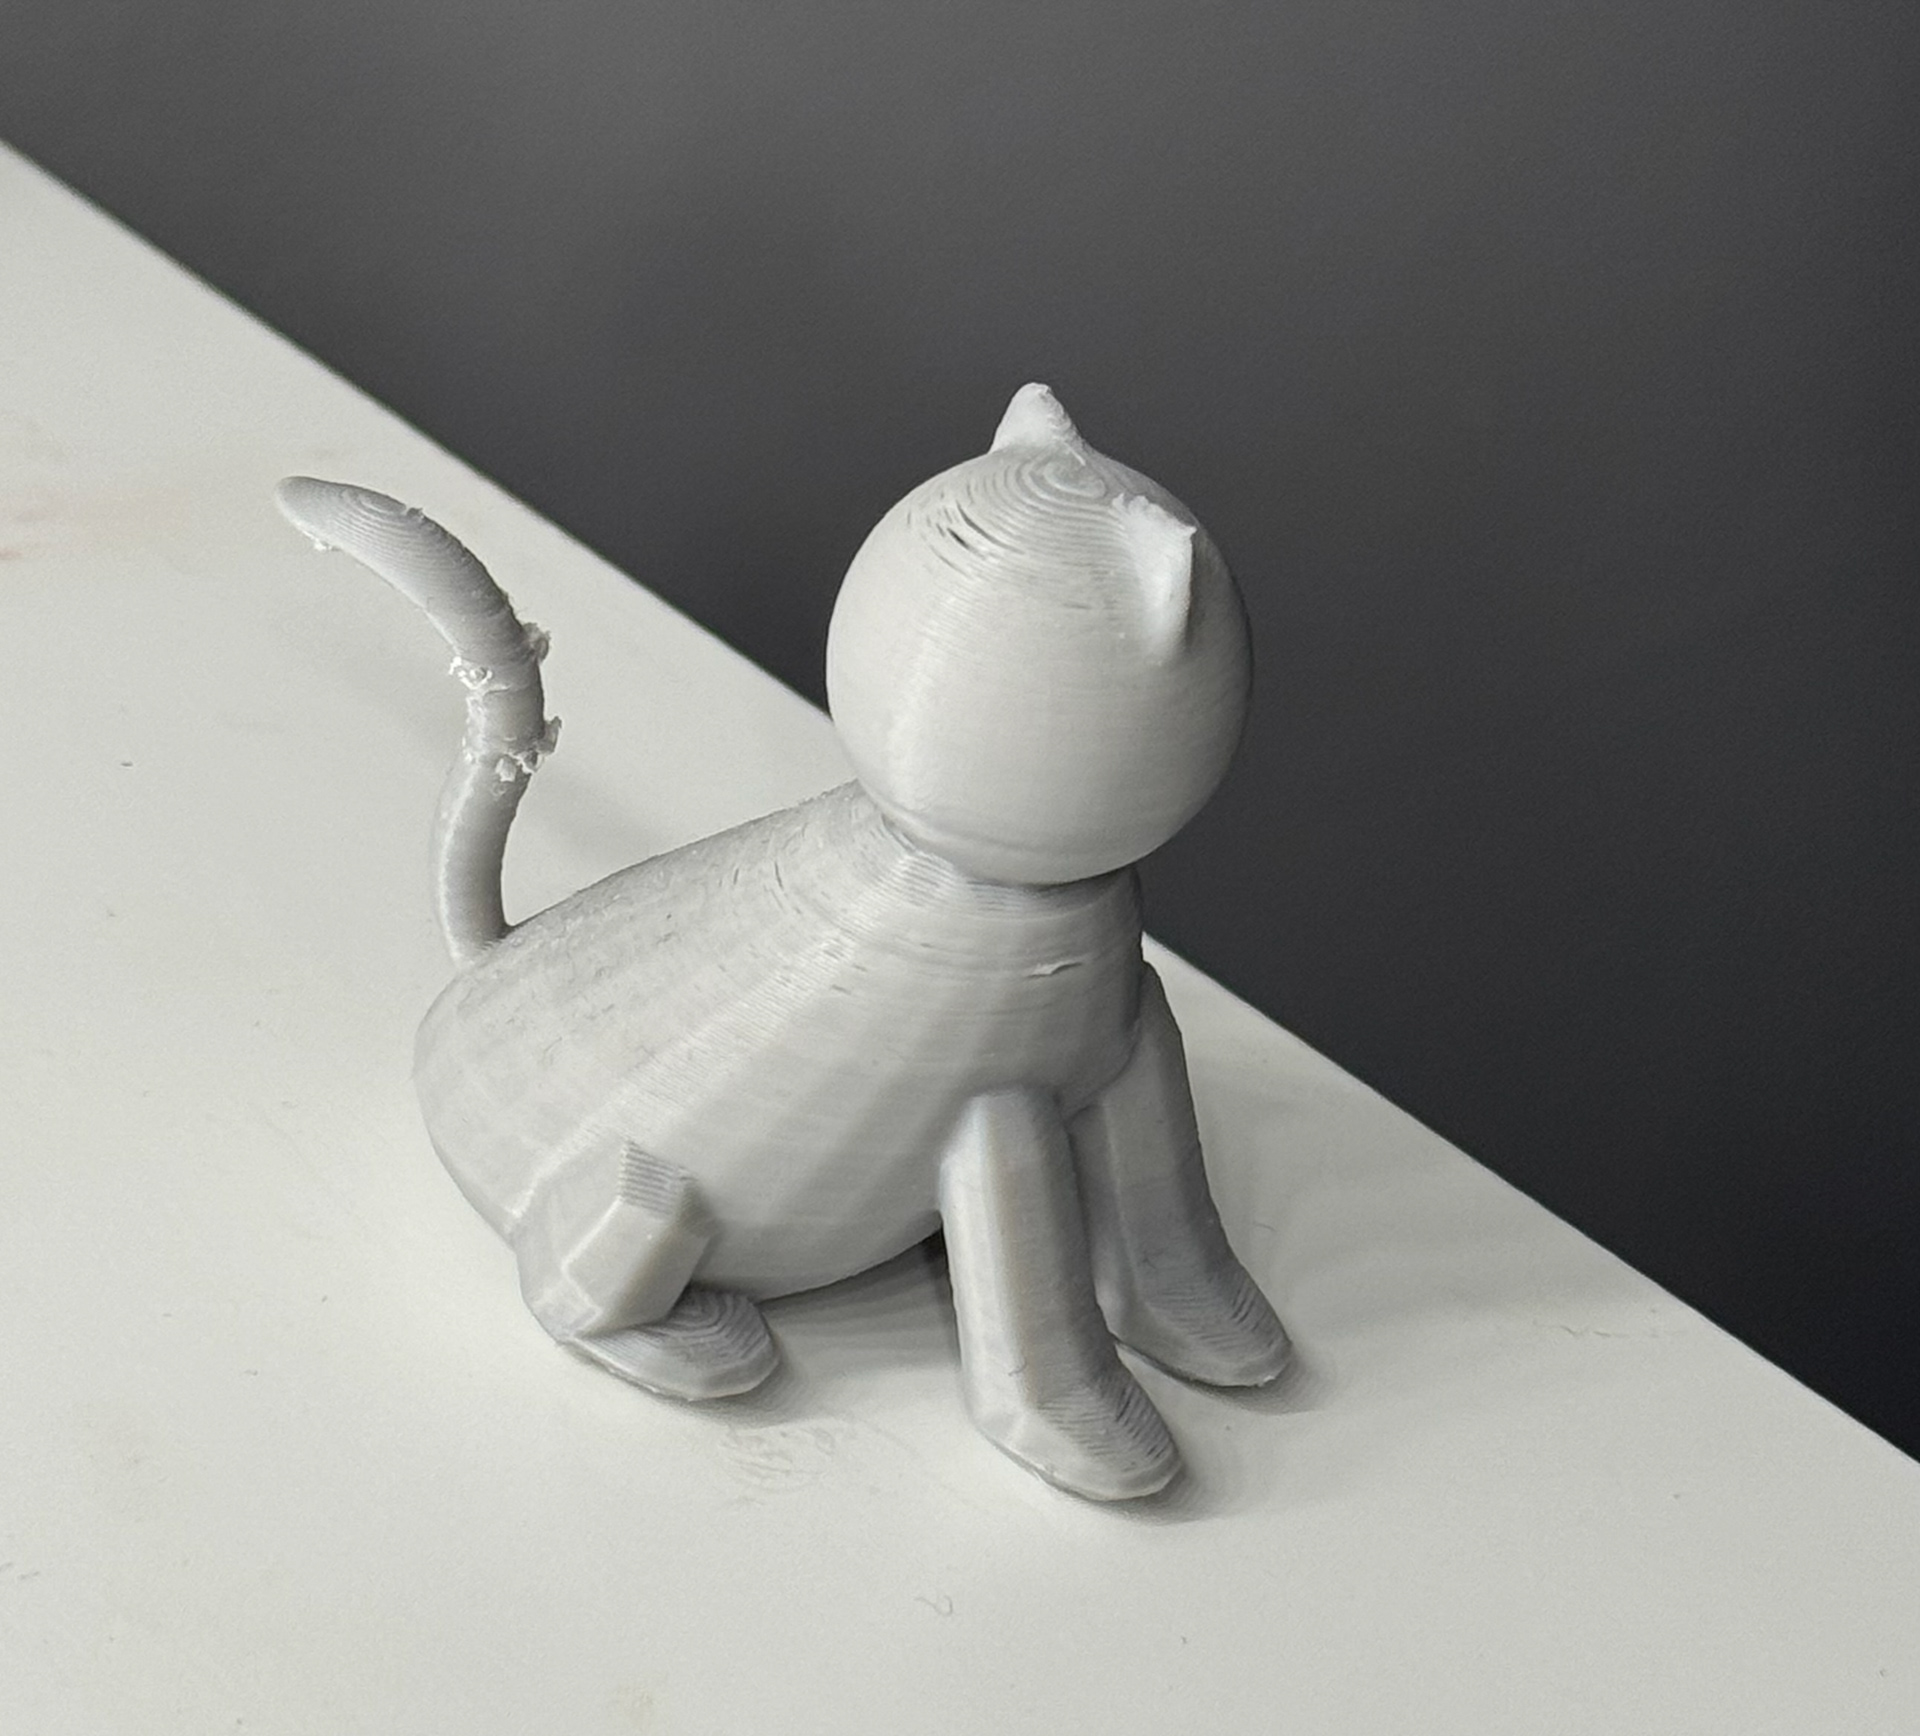
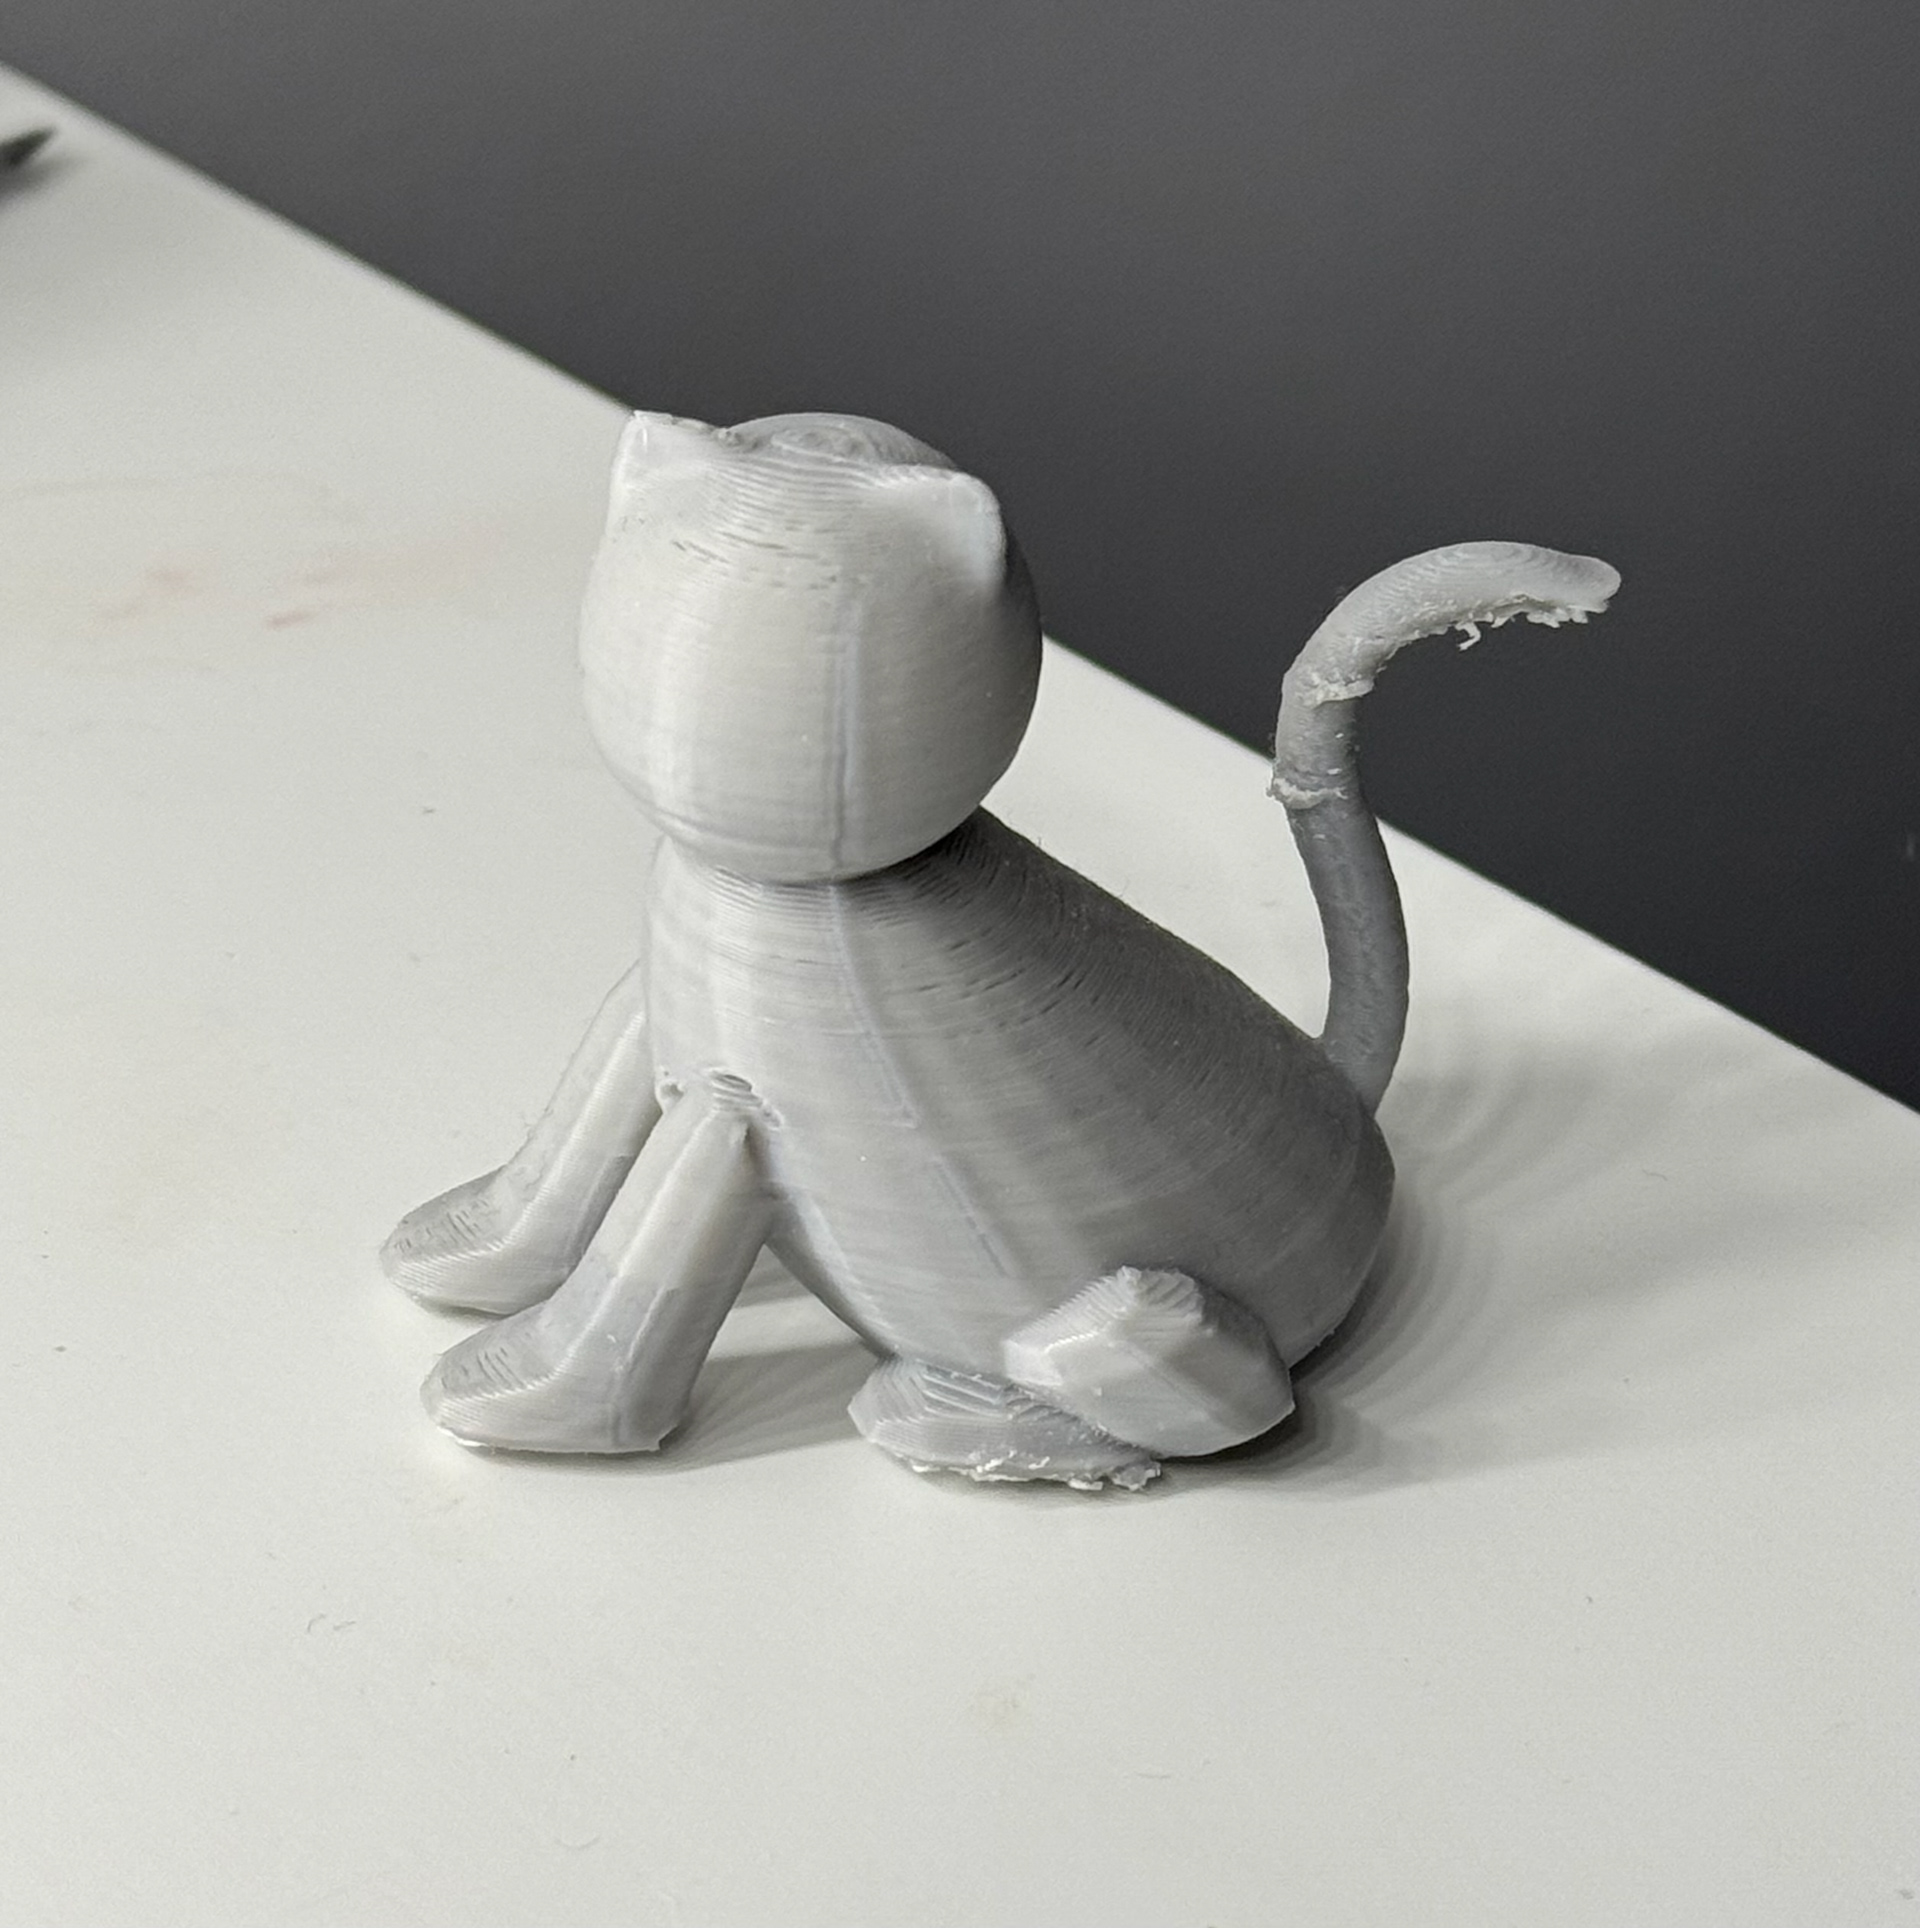
3D Modeling Projects (2023-2024)
Blender and Tinkercad
Rave Simulation Project (2023)
Max MSP
Rave Simulator 3000
This project was created for individuals who might have a hard time attending a rave. Many people who enjoy music performed at raves but cannot afford to go to them, or feel overstimulated by the crowds, flashing lights, and drug use that happen at raves. We wanted to create something that would allow people to experience the thrill of a rave without physically attending one. Using this MaxMSP creation, they can put the filter to lower the flashing. This includes a video of a rave and a camera filter that allows you to be included in a rave. It consists of both the sound and video, producing a synchronized combination of both. It uses the CPX as a light receiver, so the closer you put your hand to the CPX, the less the video will show.
Adobe Creative Suite Projects
2022-2026

Visual Studio Code
2023